Trademarks
The following are trademarks of James Orr and/or Real Estate Financial Planner™ LLC. All rights reserved.
Return Quadrants™
39 trademarksThe Return Quadrant™ framework is a proprietary four-quadrant visualization system that breaks down real estate investment returns into four distinct streams: appreciation, cash flow, loan paydown, and tax benefits from depreciation.
Each quadrant type measures these streams from a different perspective — total dollars, return on equity, return on investment, or return on True Net Equity™. The "+Reserves" variants incorporate the impact of cash reserves set aside for vacancies, repairs, and capital expenditures, providing a more conservative and complete picture of investment performance.
Appreciation
$7,500
Cash Flow
$4,200
Debt Paydown
$3,800
Tax Benefits
$2,100
Total
$17,600
© 2026 Return in Dollars Quadrant™ from Real Estate Financial Planner LLC
How the Four Quadrant Types Differ
How many dollars am I making?
What % return on money invested?
How hard is my equity working?
What’s my return on accessible equity?
Appreciation
$7,500
Cash Flow
$4,200
Debt Paydown
$3,800
Tax Benefits
$2,100
Total
$19,400
+ Reserves $1,800
Every base quadrant has a +Reserves variant that adds the gray row beneath the 2×2 grid. This row shows the return earned on cash reserves — the interest or yield generated by money the investor holds in reserve accounts for vacancies, repairs, and capital expenditures.
Because reserves earn a return for the investor, this value is typically positive — representing additional income beyond the four core streams. The "+R6" and "+R12" suffixes indicate how much the investor sets aside: six months or twelve months of operating expenses held in reserves. Importantly, for percentage-based quadrants like ROIQ™, the reserves amount is also added to the denominator as part of the total capital invested — since money set aside in reserves is capital the investor has committed to the investment.
Framework
Also trademarked as: Return Quadrants™
Base Quadrants
The four foundational quadrant views — each measures the same four return streams from a different investor perspective.
Also trademarked as: RIDQ™, Return In Dollars + Reserves™, Return In Dollars + Reserves Quadrant™, RIDQ+R™, RID+R™, RID+R Quadrant™, RIDQ+R6™, RIDQ+R12™
Also trademarked as: ROIQ™, Return On Investment + Reserves™, Return On Investment Quadrant + Reserves™, ROIQ+R™, ROI+R™, ROI+R Quadrant™, ROIQ+R6™, ROIQ+R12™
Also trademarked as: ROEQ™, Return On Equity + Reserves™, Return On Equity + Reserves Quadrant™, ROEQ+R™, ROE+R™, ROE+R Quadrant™, ROEQ+R6™, ROEQ+R12™
Also trademarked as: ROTNEQ™, Return On True Net Equity + Reserves™, Return On True Net Equity + Reserves Quadrant™, Return On True Net Equity Quadrant + Reserves™, ROTNEQ+R™, ROTNE+R™, ROTNE+R Quadrant™, ROTNEQ+R6™, ROTNEQ+R12™
Financial Planning & Analysis
26 trademarksCore concepts, tools, and methodologies for analyzing real estate investments with precision. These trademarks represent proprietary metrics and analytical frameworks designed to give investors a more accurate understanding of property performance than conventional calculations provide.
Cash Flow Power Meter™
Five breakeven zones show exactly how resilient a property's cash flow is — from gray (worst) to dark green (best).
Rent Resiliency: $500/mo
20.8% cushion above managed breakeven
© 2026 Cash Flow Power Meter™ from Real Estate Financial Planner LLC
The black vertical line marks where actual rent sits on the meter. Each colored zone describes what your cash flow position is at that rent level. The lines where two zones meet are the exact breakeven thresholds.
- Dark green — Cash-flow positive even with a property manager. No special credits needed.
- Light green — Self-managed positive, but a property manager would push cash flow negative.
- Yellow — Positive self-managed only because of the Cash Flow from Depreciation™ tax benefit. Without it, cash flow is negative.
- Red — Positive only when counting both the depreciation tax benefit and mortgage principal paydown as returns. Without both, cash flow is negative.
- Gray — Negative under every scenario, even counting all returns.
Rent Resiliency™ is the companion metric — it measures the dollar amount and percentage by which rent could drop before the property becomes cash-flow negative with property management. In this example, rent could fall by $500/mo (20.8%) before reaching the managed breakeven threshold.
True Net Equity™ Equity Allocation™
A horizontal bar showing where each dollar of property value goes if you sold today — mortgage payoff, commissions, closing costs, taxes, and what you actually keep.
True Net Equity™: $86,854
62.4% of equity retained after all selling costs and taxes
© 2026 True Net Equity™ from Real Estate Financial Planner LLC
The bar represents the total property value. Each colored segment shows a cost that would be deducted if the property were sold today: mortgage payoff (gray), real estate commissions (purple), closing costs (orange), capital gains tax (red), and depreciation recapture tax (amber).
The green segment is True Net Equity™ — what you would actually walk away with after all selling costs and taxes. The Equity Retained percentage shows how much of your raw equity (property value minus mortgage) survives the selling process. A property with high equity retained is more capital-efficient to sell.
Return Stream Map™
Each return stream mapped by timing (Cash Now vs Cash Later) and certainty (More Certain vs More Speculative).
Market-dependent
$7,500
Lease-dependent, variable
$4,200
Locked amortization schedule
$3,800
Formula-driven depreciation
$2,100
© 2026 Return Stream Map™ from Real Estate Financial Planner™ LLC
The 2×2 grid classifies every return stream along two dimensions: timing (Cash Now vs Cash Later) and certainty (More Certain vs More Speculative). Each of the four streams sits in exactly one cell.
- Appreciation — Cash Later + More Speculative. Market-driven and realized only upon sale or refinance.
- Cash Flow — Cash Now + More Speculative. Dependent on lease terms and market rents, so inherently variable.
- Debt Paydown — Cash Later + More Certain. Locked by the amortization schedule; you collect it when you sell or refinance.
- Tax Benefits — Cash Now + More Certain. Formula-driven depreciation savings you receive each year.
Row and column totals let you instantly compare how much you earn now vs later and how much is certain vs speculative. In this example, $11,700 (66%) of returns are speculative while $11,300 (64%) won't be realized until the property is sold or refinanced.
Return Stream Map™ with Reserves
When reserves are enabled, a fifth stream appears in the map. Placement depends on reserve duration: 6-month reserves sit in the More Certain row; 12-month reserves sit in the More Speculative row.
Market-dependent
$7,500
Lease-dependent, variable
$4,200
Locked amortization schedule
$3,800
Formula-driven depreciation
$2,100
$380
© 2026 Return Stream Map™ from Real Estate Financial Planner™ LLC
When reserves are enabled, a fifth stream — Reserves — appears in the Cash Now column. Its row placement depends on how long you hold reserves:
- 6-month reserves (R6) — Cash Now + More Certain. Short-duration reserves parked in a savings account earn a predictable, modest yield.
- 12-month reserves (R12) — Cash Now + More Speculative. Longer-duration reserves may be invested in higher-yield vehicles with more variability.
In this example, 6-month reserves add $380/yr to the More Certain row, bumping the row total from $5,900 to $6,280 and the Cash Now column total from $6,300 to $6,680.
Brand & Platform
Also trademarked as: REFP™
Also trademarked as: Real Estate Financial Plan™
Also trademarked as: Blueprints™
Also trademarked as: Real Estate Financial Advisor™
Proprietary Metrics
Calculations that go beyond standard industry metrics to reveal what investors are actually earning, spending, and keeping.
Analysis Tools & Frameworks
Each zone describes what your cash flow situation looks like at that rent level. Gray ("Negative — Even Counting All Returns") means rent is too low to break even under any scenario, even when counting mortgage principal paydown and Cash Flow from Depreciation™ as positive returns. Red ("Positive Only w/ Paydown + Depreciation") means rent only breaks even when both principal paydown and Cash Flow from Depreciation™ are counted as returns — without both credits, the property is cash-flow negative. Yellow ("Positive Only w/ Depreciation Tax Benefit") means rent breaks even self-managed only because of the Cash Flow from Depreciation™ tax saving — remove it and cash flow turns negative even when self-managing. Light green ("Self-Managed Positive") means rent covers all expenses when self-managing with no special credits, but adding a property manager would push cash flow negative. Dark green ("Cash-Flow Positive With Management") means the property generates positive cash flow even with professional property management — no special credits required.
The black line marks the actual rent. The further to the right it sits, the stronger the cash flow position. The lines where two zones meet are the breakeven thresholds — the exact rent at which the property transitions from negative to positive under each scenario.
The companion metric, Rent Resiliency™, measures the dollar amount and percentage by which rent could drop before the property becomes cash-flow negative with property management — calculated as actual rent minus the managed breakeven threshold.
The tool also includes an embeddable PNG image generator and an interactive image builder for sharing meter snapshots outside the platform.
Also trademarked as: The World's Greatest Real Estate Deal Analysis App™
Resiliency & Risk Management
13 trademarksResiliency™ measures how much a specific factor can change before a property crosses into negative cash flow or negative equity. Each metric answers a concrete question: "How much can X increase (or decrease) before this property starts losing money?" Resiliency can be expressed as a percentage (e.g., rent can drop 12% before negative cash flow) or in dollar amounts (e.g., rent can drop $150/mo before negative cash flow). Higher resiliency means more room to absorb adverse changes.
The Resiliency™ Metrics
How much can each factor change — in dollars or as a percentage — before you have negative cash flow or negative equity?
The overall measure — how much can total expenses increase or total income decrease before cash flow turns negative? Each factor below has its own individual resiliency metric.
Income
How much rent can decline
How much vacancy can increase
Operating Costs
How much property taxes can increase
How much insurance premiums can increase
How much HOA dues can increase
How much owner-paid utilities can increase
Upkeep & Management
How much maintenance costs can increase
How much management costs can increase
How much capital expenditures can increase
Also: Equity Resiliency™
How much the property price or market value can change before you have negative equity.
Cash Flow Resiliency Metrics
Each income and expense factor has its own Cash Flow Resiliency™ metric, measuring how much that single factor can change before the property crosses into negative cash flow.
Equity Resiliency Metrics
These metrics measure how much property values can change before equity turns negative — meaning the investor owes more than the property is worth.
Also trademarked as: Equity Resiliency™
Nomad™
6 trademarksNomad™ is a proprietary real estate investing strategy where an investor buys a property as their primary residence using owner-occupied financing (lower down payments and better interest rates), lives in it for the minimum required period, then converts it to a rental property and repeats the process with a new home. Over time, this builds a portfolio of rental properties acquired with favorable financing terms.
Strategy
Software & Tools
Also trademarked as: Nomad Calculator Classic™, Nomad Calculator 3™
Community
Also trademarked as: Nomad Investor Clubs™
Groups & Community
7 trademarksTrademarks associated with real estate investment groups, professional networks, and community programs that bring investors and real estate professionals together to learn, collaborate, and grow.
Investment Groups
Also trademarked as: Northern Colorado Real Estate Investor Group™, Northern Colorado Real Estate Investors Group™, NCREIG™
Professional Programs
Financial Independence
6 trademarksFrameworks and metrics for defining, measuring, and achieving financial independence through real estate investing — giving investors concrete milestones and targets rather than vague aspirations.
The Four Phases of Financial Independence™
Each phase is named after the goal you are working toward achieving.
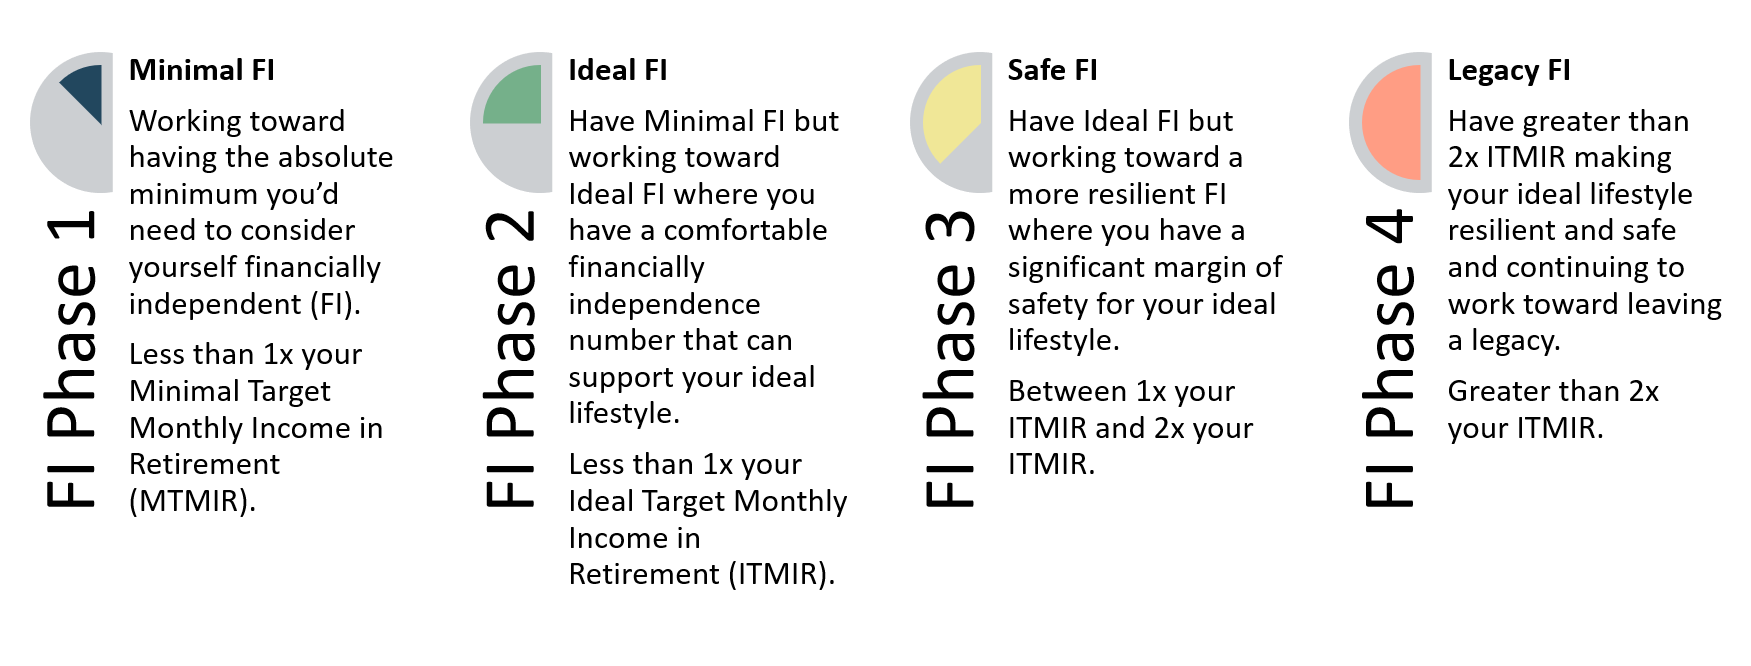
Working toward having the absolute minimum you’d need to consider yourself financially independent.
Similar to what others in the FIRE community call “Lean FIRE” — but you must not need to work to get by. If you still need a job or side hustle to cover basics, you haven’t reached this milestone yet.
Working toward having enough saved and invested to support your ideal lifestyle — not just the basics.
Similar to what others call “Fat FIRE.” The key: your investments must supply the money — not a side hustle or business that requires you to work.
Working toward making sure you can sustain your ideal lifestyle even through market corrections or financial setbacks.
Working toward leaving a legacy. You’ve got more than enough and feel safe from market corrections and unexpected financial events.
Also trademarked as: MTMIR™
Also trademarked as: ITMIR™
Marketing & Education
7 trademarksEducational programs, strategic frameworks, and proprietary methodologies for teaching and applying real estate investment principles.
Also trademarked as: Alternative Universe Modeling™
Usage Guidelines
Rules for referencing these trademarks in publications, software, and marketing materials.
Proper Use
- Include the ™ symbol on first use in any document or page
- Use the exact trademark name as listed on this page
- Attribute ownership to James Orr and/or Real Estate Financial Planner™ LLC
Prohibited Use
- Using any trademark without prior written permission
- Altering, abbreviating, or modifying trademark names
- Using trademarks in a way that implies endorsement or affiliation
Licensing
For questions about trademark usage, licensing, or permissions, please contact us.